
NELHA Biota Studies
 Since 1989 NELHA has contracted 44 environmental monitoring surveys as part of its Comprehensive Environmental Monitoring Program (CEMP). The program monitors 15 anchialine ponds, as well as coral cover, and fish counts along 6 transects offshore of NELHA. Since 1989 NELHA has contracted 44 environmental monitoring surveys as part of its Comprehensive Environmental Monitoring Program (CEMP). The program monitors 15 anchialine ponds, as well as coral cover, and fish counts along 6 transects offshore of NELHA.
Recently, NELHA, UH Hilo, and Aqualink installed an underwater camera on NELHA’s intake pipeline to observe the reef in real time. To see the live stream of the reef surrounding NELHA, please click on the YouTube | Aqualink | MEGA Lab | Hawaii link or the live stream image below. Below the live-streaming camera image, NELHA presents 32 years of historical findings from its biota surveys in a user-driven graphical interface. Please feel free to virtually explore NELHA’s anchailine pond, marine coral cover and fish community data sets by selecting scatter plot and bar graph variables that are of most interest to you. |
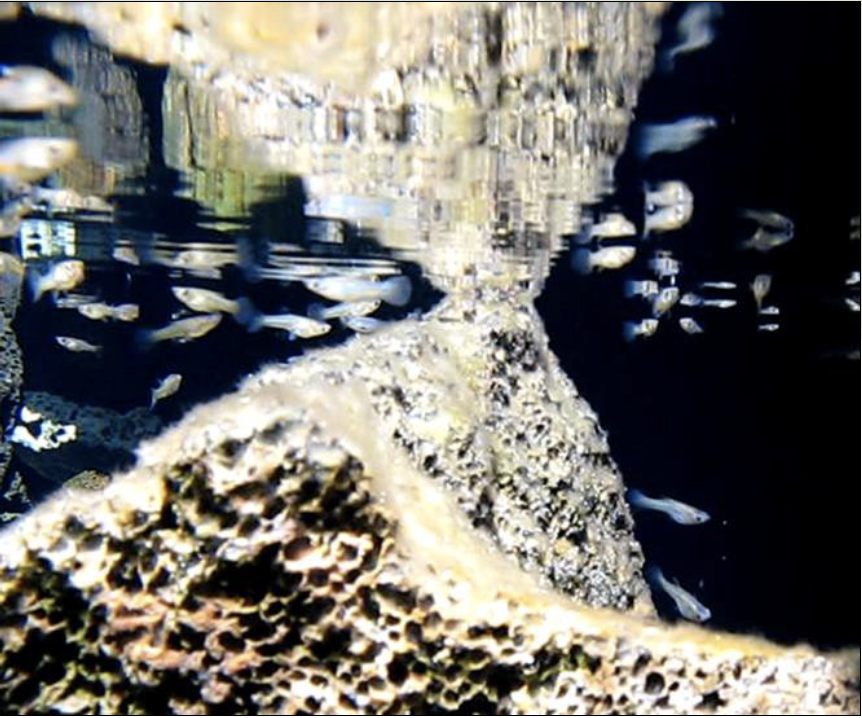
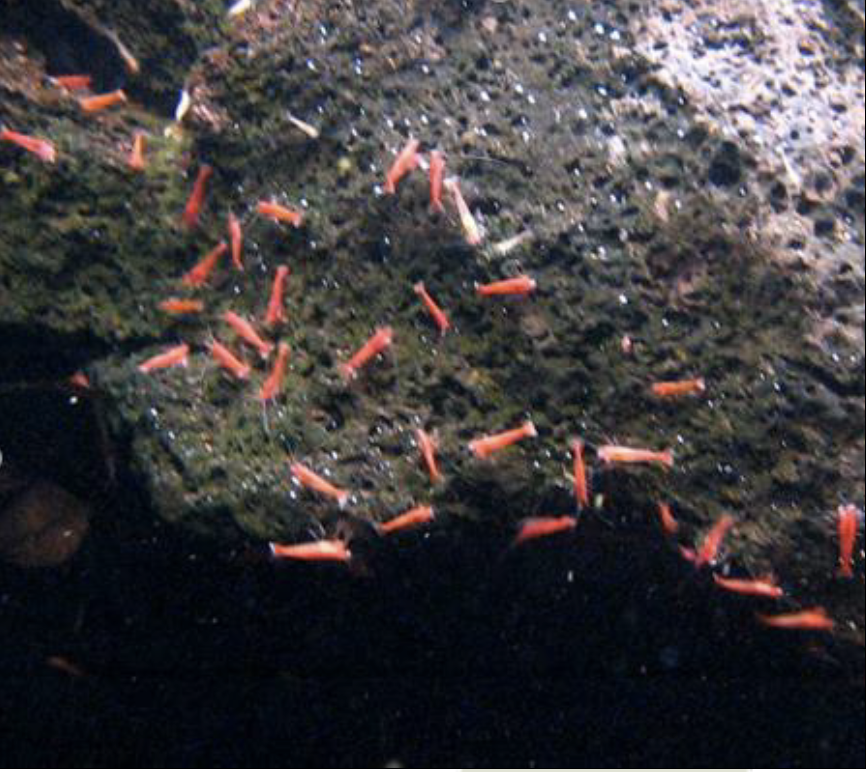
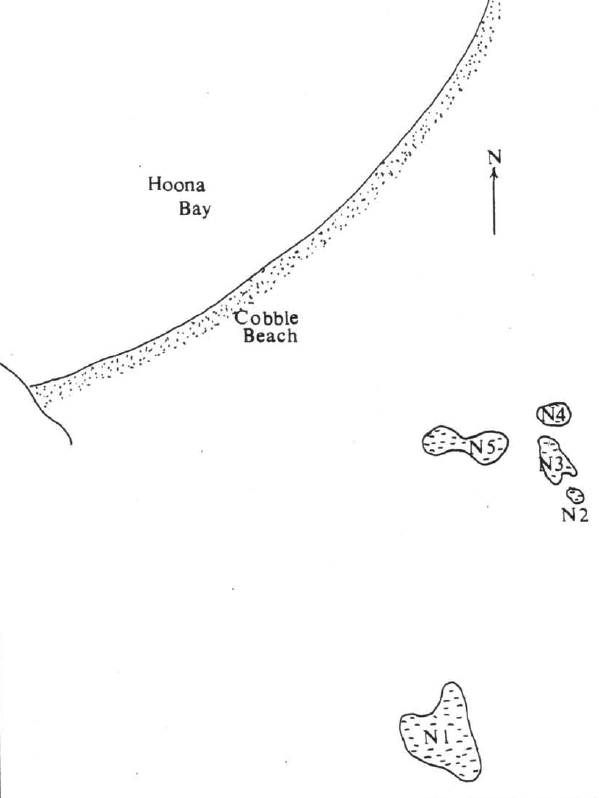
North Ponds
South Ponds
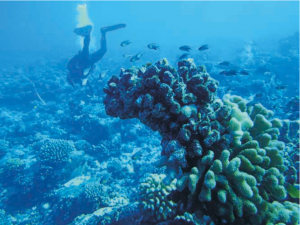
Marine Coral and Fish Community
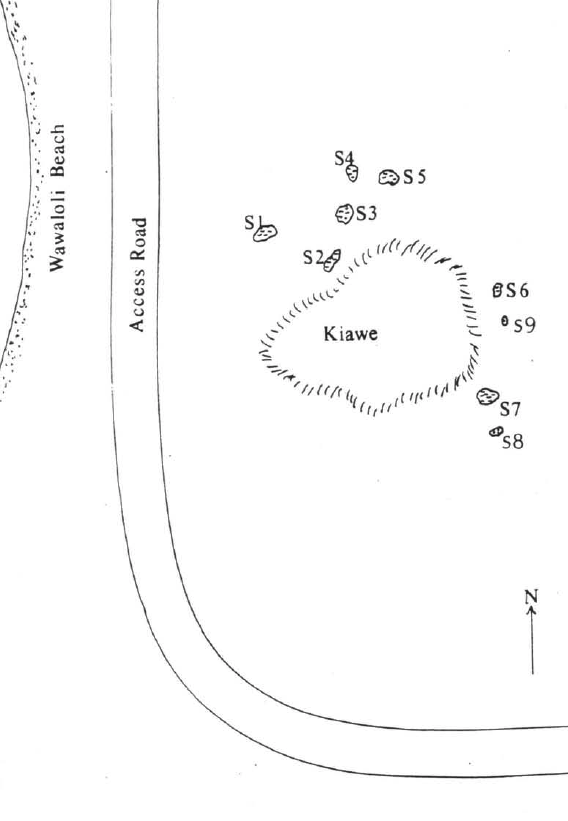
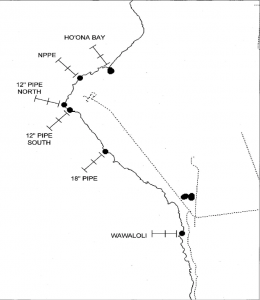 NELHA monitors the coral coverage and fish counts from 6 sites offshore of the facility. For each site, coral coverage is estimated at the shallow, mid, and deep depths, and fish are counted by divers. NELHA monitors the coral coverage and fish counts from 6 sites offshore of the facility. For each site, coral coverage is estimated at the shallow, mid, and deep depths, and fish are counted by divers.
Although there are changes in the coral and fish count from year to year, the past studies have found no evidence that these changes are a result of activities at NELHA. Coral coverage is highly susceptible to weather events, including storms and heat waves. Hurricane Iniki (1992) struck soon after the monitoring surveys started, damaging a lot of coral reefs throughout the islands. Corals were also affected by a bleaching event in 2014 and 2015. In addition, because fish communities are highly mobile, changes in fish count year to year are consistent with the expected movement of fish communities. Explore the coral coverage and fish data in the graph below. You can explore the coral and fish data either together or separately by selecting the corresponding button. You can also choose to look at the data as it relates to the site of the survey or the depth (or both). As you make selections, buttons to choose specific sites and depths may become active. In addition to using the buttons on the top, add or remove columns by selecting on the legend, and zoom in by clicking and dragging along the horizontal axis. |
Raw Coral and Fish Data
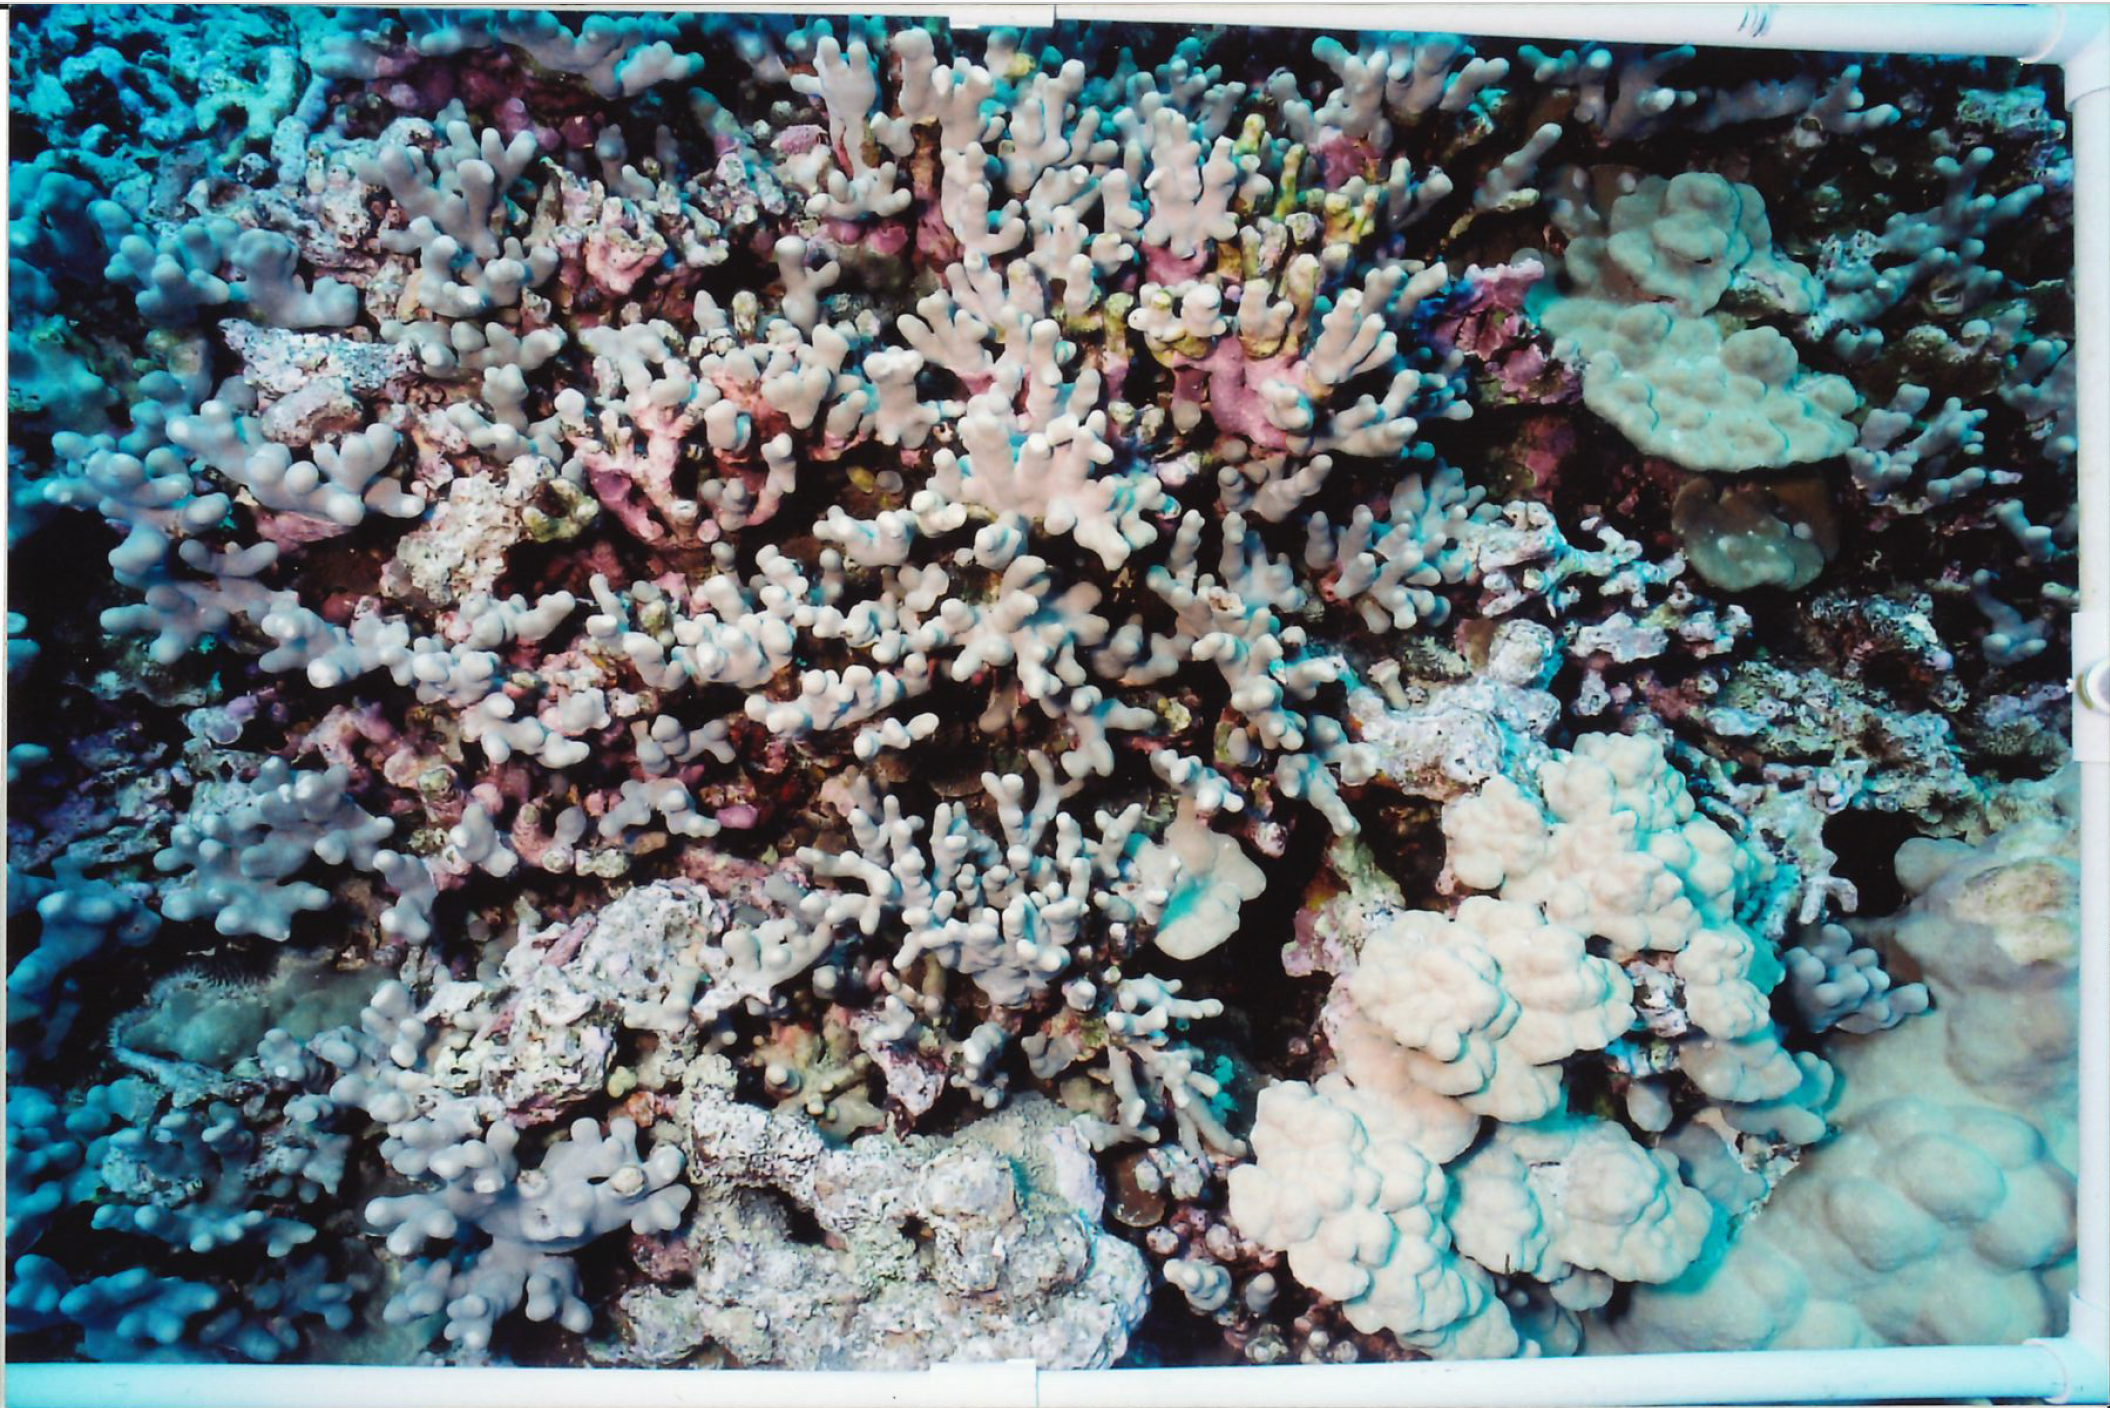
| Coral coverage is ascertained by finding the coverage in 1.0m by 0.6m quadrants. For each site and depth, a transect is laid out over which 10 quadrants are placed, allowing the researchers to estimate coral coverage in the region. In this area, there are three species of coral that dominate coral coverage. The most common along all sites and depths is the lobe coral or Porites lobata. Finger coral or Porites Compressa tends to dominate at the deeper depths, and cauliflower coral, or Pocillopora meandrina, dominates in shallower regions since it is the most tolerant of strong wave action. | ||
 |
 |
 |
Decades Coral Data
|
Explore the coral and fish data averaged across decades. You can select to see fish and coral, or each individually, using the buttons above the graph, and can add and remove columns by clicking on the legend. |